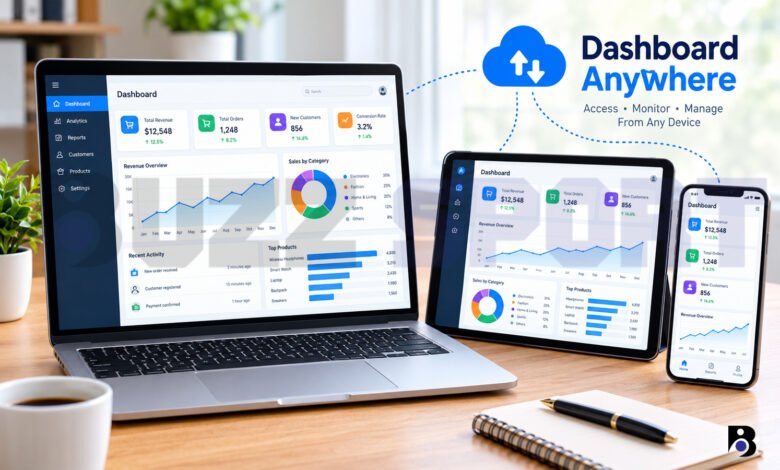
Think about the last time you wanted to check a number while you were away from your desk. Maybe it was sales for the day, the traffic on your website, or the health of a server. Years ago, you had to wait until you got back to your computer. Today, you can open the same data on your phone, tablet, or laptop in a few seconds.
Many people call this idea “dashboard anywhere”. In this guide, I will explain what it means, how it works, and how you can set it up in a safe and simple way.
What Does “Dashboard Anywhere” Mean?
“Dashboard anywhere” is not the name of one single app. It is a simple idea: you can open your dashboard from any place and on any device.
A dashboard is a screen that shows your most important numbers in one place. It can have charts, tables, maps, and small boxes with key numbers (often called KPIs). A shop owner might see daily sales. A teacher might see student progress. A team leader might see how many tasks are finished this week.
The “anywhere” part means you are not tied to one desk or one computer. You only need a device, an internet connection (in most cases), and the right permission to see the data.
Some big data tools already do this well. Microsoft Power BI, Tableau, and Google’s Looker all have mobile apps or mobile-friendly views. I will use them as real examples in this article, because their official guides are clear and easy to check.
Why More People Want Dashboards on Their Phones
There are a few simple reasons.
Work is not only at a desk. Many people work from home, from a shop floor, from a car, or from another city. They still need to see how things are going.
Quick answers matter. Sometimes you only need one number before a meeting. Opening a phone is faster than starting a laptop.
Teams stay on the same page. When everyone looks at the same live numbers, there is less confusion. Nobody has to ask, “Which file is the newest one?”
Problems show up sooner. If a number drops suddenly, you can see it early and act before it grows into a bigger problem.
What You Need Before You Start
You do not need to be a tech expert. Most setups need these four things:
- A dashboard that already exists. Someone has to create it first, and this is often done on a computer.
- An account. Most tools ask you to sign in with a work, school, or personal account.
- Permission. The owner of the dashboard must share it with you or your team.
- A device and a connection. A phone, tablet, or laptop with internet works for most tools. Some tools also let you save a copy for offline use.
One thing surprises many beginners. In Power BI, for example, the mobile apps are made for viewing and interacting with dashboards, not for creating them. You build the dashboard in a web browser first, and then it shows up in the app. Many other tools work in the same way.
Real Examples You Can Try
Let us look at three popular tools. They show how “dashboard anywhere” works in real life.
Power BI
Microsoft offers Power BI apps for iPhone, iPad, Android phones, and Android tablets. Once you have dashboards in your account, they sync to the mobile apps by themselves.
On a phone, the dashboard looks a little different from the web version. The tiles have the same width and sit one after another from top to bottom. If you turn your phone sideways, you see the whole dashboard just as it appears on the web.
If you own the dashboard, you can also make a special layout for phones. Microsoft explains that you can create a custom view for portrait mode in the Power BI service. iPhone users can even sync dashboards with an Apple Watch to see key numbers fast.
Tableau Mobile
Tableau has its own app for iOS and Android. It lets you explore dashboards that your company has published. The app needs a Tableau Server or Tableau Cloud account, and it does not work with Tableau Public.
The best part for travelers is offline access. When you mark a dashboard as a favorite, the app can save a preview. Tableau says its Favorites are downloaded while you are connected, so you can use them later even when the device is offline.
Looker and Looker Studio
Google offers a Looker mobile app. In November 2023, Google said its app for Looker Studio Pro would let people view reports and see real-time business data from anywhere on Android and iOS. The same post says the mobile app is only for Looker Studio Pro customers, so check your plan first.
The app also makes sharing easy. Google says you can share a report with one tap, and the link will open on any device.
How to Check Your Dashboard on Any Device: Step by Step
The exact buttons are different in each tool, but the steps are almost always the same.
Step 1: Ask for access or create your dashboard
If someone else made the dashboard, ask them to share it with your account. If you made it, make sure your teammates have the right permission to view it.
Step 2: Choose how you want to open it
You have two simple choices:
- Use the official app. This is usually the smoothest way on a phone or tablet. Download it only from the App Store or Google Play.
- Use a web browser. This works on almost any device, including a laptop or a computer you borrow. It is also a good plan when the app is not available for your plan.
Step 3: Sign in
Use the same account that has permission to see the dashboard. Some apps, like the Looker app, let you turn on biometric sign-in after you log in. That means you can use your fingerprint or face instead of typing a password each time.
Step 4: Find your dashboard
Most apps have a home page with recent items, a search bar, and a Favorites list. Mark the two or three dashboards you check most as favorites. This saves a lot of time.
Step 5: Look, tap, and filter
Tap on a chart to see more details. Use filters to change the date range or choose one product, team, or place. Turn your phone sideways if the chart feels too small.
Step 6: Share what you found
Most apps let you send a link or a snapshot to a teammate. Before you share, check that the other person has permission to see the data. A link alone may not work for people outside your team.
What If You Have No Internet?
Not every place has a strong signal. Planes, trains, farms, and basements are common problems.
Some tools help with this. Tableau Mobile, as we saw, saves previews of your favorite dashboards. A guide that explains Tableau Mobile says that making a workbook a favorite makes the app save an interactive snapshot of it.
Keep one thing in mind. An offline snapshot shows the data from the last time you were connected. It is not live. Always check the time of the last update before you make a big decision.
How to Keep Your Dashboard Safe
When you can open your data from anywhere, it is also easier for the wrong person to try to open it. A few simple habits make a big difference.
Turn on multifactor authentication (MFA). MFA means you need a second step to prove who you are, such as a code on your phone. The US cyber agency CISA explains that a second method to verify your identity can make you much more secure. The same page says that people who turn on MFA are much less likely to get hacked.
Use a strong, different password. A password manager can help you make and store them.
Lock your phone. Use a PIN, a fingerprint, or face unlock. If you lose your phone, this is your first line of defense.
Share with care. Give people the lowest level of access they need. A person who only needs to look at the numbers does not need permission to edit the dashboard.
Avoid public Wi-Fi for private data. If you must use it, use a trusted VPN, or switch to your mobile data.
Keep your apps updated. Updates often fix security problems.
If you work for a company, follow your company’s rules. Some tools can even be managed by the IT team. For example, Microsoft says organizations can use Microsoft Intune to manage devices and the Power BI mobile apps on Android and iOS.
How to Make Your Dashboard Easy to Read on a Small Screen
A dashboard that looks great on a big monitor can feel messy on a phone. If you build dashboards, these tips can help.
Show fewer numbers
A small screen has no room for twenty charts. One design guide suggests this plan: pick one main number, then three or four that support it, and remove any number that nobody would act on. This is a good question to ask for every chart: “Will anyone do something because of this number?”
Put the most important things first
Make the key numbers bigger and place them near the top. A guide from Geckoboard suggests you use size and position to show what is most important, and group related numbers together.
Keep it clean
Use clear fonts, enough space, and the same colors everywhere. Use bright colors only for things that need attention, like a warning.
Make a phone version
Many tools let you design a separate layout for phones. In Power BI, you can do this in the service. In Looker Studio, Google has added a layout style called responsive reports. A guide on this feature explains that these layouts scale and rearrange themselves based on screen size. The same guide notes that you need to start a new report with this layout, because older reports cannot be changed to the new format unless they have only one chart.
Test on a real phone
Open your dashboard on your own phone before you share it. Check that the text is easy to read and the buttons are easy to tap with a thumb.
Common Problems and Easy Fixes
“I can sign in, but I cannot see my dashboard.” You may not have permission. Ask the owner to share it with the same email you used to sign in.
“The numbers look old.” The data may refresh on a schedule, or you may be looking at an offline copy. Pull down to refresh, or check the last updated time.
“The charts look tiny or cut off.” Turn your phone sideways. If it still looks bad, ask the dashboard owner to create a phone layout.
“The app does not work with my account.” Some apps only work with certain plans. As we saw, Tableau Mobile does not work with Tableau Public, and the Looker Studio Pro app is for Pro customers. Check the requirements on the official help page.
“I forgot my password.” Use the reset link on the sign-in page. Do not ask a coworker to share their login with you.
A Quick Checklist
Before you rely on a dashboard from your phone, check these things:
- I have an account and the right permission.
- I installed the app from an official store, or I know the web link.
- MFA is turned on.
- My phone has a lock.
- My favorite dashboards are saved for fast access.
- I know how fresh the data is.
- The dashboard is easy to read on a small screen.
Final Thoughts
Checking your data on any device is not magic. It is a mix of three simple things: a dashboard that is built well, an app or browser that can open it, and good security habits. When these three parts work together, you can see what is happening in your work or business from almost anywhere.
Start small. Pick one dashboard, make it simple, test it on your phone, and turn on MFA. After that, you can add more features step by step.
Frequently Asked Questions
Is “Dashboard Anywhere” a real app I can download?
“Dashboard anywhere” is mostly a general idea, not one famous app. You may find different pages online that use the name in different ways. The safest way to get this kind of access is to use a trusted tool with an official mobile app or a mobile web view, like Power BI, Tableau, or Looker. Always read the official help pages and download apps only from the App Store or Google Play.
Can I build a dashboard on my phone?
Usually, you cannot do much building on a phone. In most tools, the phone is for viewing, filtering, and sharing. You make the dashboard on a computer first. Tableau is a small exception, because its app offers an edit mode on iPad only. For serious building, a laptop or desktop is still the best choice.
Is it safe to check business data on my phone?
It can be safe if you use good habits. Turn on multifactor authentication, lock your phone, use strong passwords, and avoid public Wi-Fi when possible. Also, only share dashboards with people who need them. If your company has security rules, follow them, because the IT team may manage your apps and devices.